|
In the summer of 2016, Manchester United paid £89 million to bring Paul Pogba back from Juventus. It was a world record transfer fee at the time. Three years later, they spent £80 million on Harry Maguire, setting a new global record for a defender. Then £73 million on Jadon Sancho. Then £82 million on Antony. The numbers kept growing. The trophies did not.
Measuring the return on that kind of spending is not a clean exercise. Football does not reduce to spreadsheets. But it does reduce to data — appearances, goals, assists, and what the club recovered when the player left. Those are facts, and facts tend to cut through narrative fairly quickly.
That instinct — to weigh the number put in against the result that came out — applies across competitive systems generally. Analysts who study long-run returns in other fields, from poker to markets to platforms like incaspin casino, treat fee-to-output ratios the same way. The entry cost is only half the story. The other half is what you actually got for it. At Old Trafford since 2013, that second half makes for uncomfortable reading.
The numbers in one place
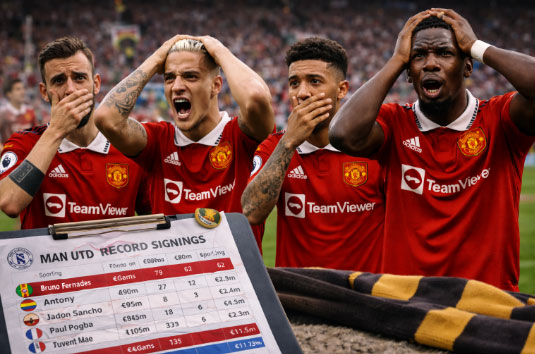
The table below covers six of the seven largest transfer fees in the club’s history. It records the fee paid, total appearances in all competitions, combined goals and assists, and the recovery fee when the player departed. All figures come from publicly reported transfer data and official club records.
Player |
Year |
Fee (£m) |
Apps |
Goals+Assists |
Exit (£m) |
Paul Pogba |
2016 |
89 |
233 |
90 (39G+51A) |
0 (free, 2022) |
Antony |
2022 |
82 |
69 |
14 (12G+2A) |
~21 (2025) |
Harry Maguire |
2019 |
80 |
254 |
24 (17G+7A) |
still at club |
Jadon Sancho |
2021 |
73 |
82 |
18 (12G+6A) |
~30 (2025) |
Romelu Lukaku |
2017 |
75 |
96 |
55 (42G+13A) |
74 (2019) |
Angel Di Maria |
2014 |
60 |
32 |
15 (4G+11A) |
44 (2015) |
The total outlay across these six signings: £459 million. The total recovered on exit: roughly £169 million. That leaves a net spend on this group alone of approximately £290 million, from players who produced a combined 766 appearances and 216 goal contributions. That works out at just under £1.35 million per goal or assist, and around £380,000 per appearance.
Those numbers do not tell you whether a signing was good or bad in isolation. Context matters. Some of these players contributed to trophies. Others barely contributed at all. But the aggregate figure frames the scale of the problem.
Where the money went most visibly wrong
Angel Di Maria set the tone early. He arrived in 2014 for £60 million as a proven Champions League-level player and left twelve months later for £44 million, having scored four goals in 32 appearances. He was played in six different positions under Louis van Gaal and never settled. The club lost £16 million on a player who was nearly invisible for large stretches of his only season.
Antony cost £82 million in 2022 and produced twelve goals in 69 appearances before leaving for Real Betis for roughly £21 million in 2025. The gap between his performances at Ajax and his performances in the Premier League was stark. Over three seasons, he averaged fewer than five goals per year for a fee that put him in the top three purchases in club history.
Jadon Sancho arrived in 2021 for £73 million with an extraordinary Bundesliga record: 50 goals and 64 assists across four seasons at Dortmund. At United he managed 12 goals in 82 appearances, a public falling out with his manager, two loan spells, and an eventual sale for approximately £30 million. The club lost around £43 million on a 25-year-old who, by most accounts, was not given a clear role or consistent support.
The Pogba case is different in structure but similar in outcome. He cost £89 million in 2016, spent six seasons at the club, won the Europa League in his first year, contributed 90 goal involvements across 233 appearances, and then left on a free transfer in 2022. The club received nothing back on a nine-figure investment. For comparison, Rio Ferdinand cost £29 million in 2002 and made 455 appearances over twelve years, winning six league titles. He also generated a reasonable sale fee when he left.
What the pattern actually shows
Several things stand out when you look at the data across the full group rather than case by case.
-
No signing in the top six by fee has generated more than 233 appearances, and only Maguire has passed 250 in total
-
The average goals-plus-assists return per £10 million spent across this group is fewer than five
-
Five of the six signings either left for less than they were bought for or remain at the club without having justified the fee in output terms
-
Only Lukaku recovered close to his purchase price on exit, and his two-season spell produced 42 goals from a £75 million striker
The contrast with the Ferguson era is not subtle. Ferdinand at £29 million. Cristiano Ronaldo at £12.2 million in 2003, with a later sale for £80 million. Ruud van Nistelrooy at £19 million, 150 goals in 219 games. Wayne Rooney at £27 million, 253 goals in 559 appearances. Those numbers reflect a different market era, but they also reflect a different approach to identifying what a player would actually do in the system.
The structural issue behind the figures
Manchester United broke the British transfer record six times between 2001 and 2022. Each time, they paid more than any English club had paid before. The fees are not the problem on their own. What the data suggests is that the club has consistently overestimated how well certain players would translate to a specific environment, and has underestimated the cost of getting that wrong.
There is also a recovery problem. When a £89 million player leaves for free, or an £82 million player leaves for £21 million, that money does not come back. It cannot be reinvested. The squad has to be rebuilt with reduced resources, which typically means another round of expensive signings to address the gaps left by the last round of expensive signings.
By the start of the 2025-26 season, the club had spent over £1.5 billion on transfers since Ferguson retired in 2013, without winning a league title. The fee-to-output ratio across the record signings specifically suggests that the spending gap and the trophy gap are not unrelated. When the numbers do not add up individually, they tend not to add up collectively either. |